Home » BTC
}
function loadTrinityPlayer(targetWrapper, theme,extras=”) {
cleanupPlayer(targetWrapper); // Always clean first
targetWrapper.classList.add(‘played’);
// Create script
const scriptEl = document.createElement(“script”);
scriptEl.setAttribute(“fetchpriority”, “high”);
scriptEl.setAttribute(“charset”, “UTF-8”);
const scriptURL = new URL(`https://trinitymedia.ai/player/trinity/2900019254/?themeAppearance=${theme}${extras}`);
scriptURL.searchParams.set(“pageURL”, window.location.href);
scriptEl.src = scriptURL.toString();
// Insert player
const placeholder = targetWrapper.querySelector(“.add-before-this”);
placeholder.parentNode.insertBefore(scriptEl, placeholder.nextSibling);
}
function getTheme() {
return document.body.classList.contains(“dark”) ? “dark” : “light”;
}
// Initial Load for Desktop
if (window.innerWidth > 768) {
const desktopBtn = document.getElementById(“desktopPlayBtn”);
if (desktopBtn) {
desktopBtn.addEventListener(“click”, function () {
const desktopWrapper = document.querySelector(“.desktop-player-wrapper.trinity-player-iframe-wrapper”);
if (desktopWrapper) loadTrinityPlayer(desktopWrapper, getTheme(),’&autoplay=1′);
});
}
}
// Mobile Button Click
const mobileBtn = document.getElementById(“mobilePlayBtn”);
if (mobileBtn) {
mobileBtn.addEventListener(“click”, function () {
const mobileWrapper = document.querySelector(“.mobile-player-wrapper.trinity-player-iframe-wrapper”);
if (mobileWrapper) loadTrinityPlayer(mobileWrapper, getTheme(),’&autoplay=1′);
});
}
function reInitButton(container,html){
container.innerHTML = ” + html;
}
// Theme switcher
const destroyButton = document.getElementById(“checkbox”);
if (destroyButton) {
destroyButton.addEventListener(“click”, () => {
setTimeout(() => {
const theme = getTheme();
if (window.innerWidth > 768) {
const desktopWrapper = document.querySelector(“.desktop-player-wrapper.trinity-player-iframe-wrapper”);
if(desktopWrapper.classList.contains(‘played’)){
loadTrinityPlayer(desktopWrapper, theme,’&autoplay=1′);
}else{
reInitButton(desktopWrapper,’‘)
const desktopBtn = document.getElementById(“desktopPlayBtn”);
if (desktopBtn) {
desktopBtn.addEventListener(“click”, function () {
const desktopWrapper = document.querySelector(“.desktop-player-wrapper.trinity-player-iframe-wrapper”);
if (desktopWrapper) loadTrinityPlayer(desktopWrapper,theme,’&autoplay=1’);
});
}
}
} else {
const mobileWrapper = document.querySelector(“.mobile-player-wrapper.trinity-player-iframe-wrapper”);
if(mobileWrapper.classList.contains(‘played’)){
loadTrinityPlayer(mobileWrapper, theme,’&autoplay=1′);
}else{
const mobileBtn = document.getElementById(“mobilePlayBtn”);
if (mobileBtn) {
mobileBtn.addEventListener(“click”, function () {
const mobileWrapper = document.querySelector(“.mobile-player-wrapper.trinity-player-iframe-wrapper”);
if (mobileWrapper) loadTrinityPlayer(mobileWrapper,theme,’&autoplay=1′);
});
}
}
}
}, 100);
});
}
})();
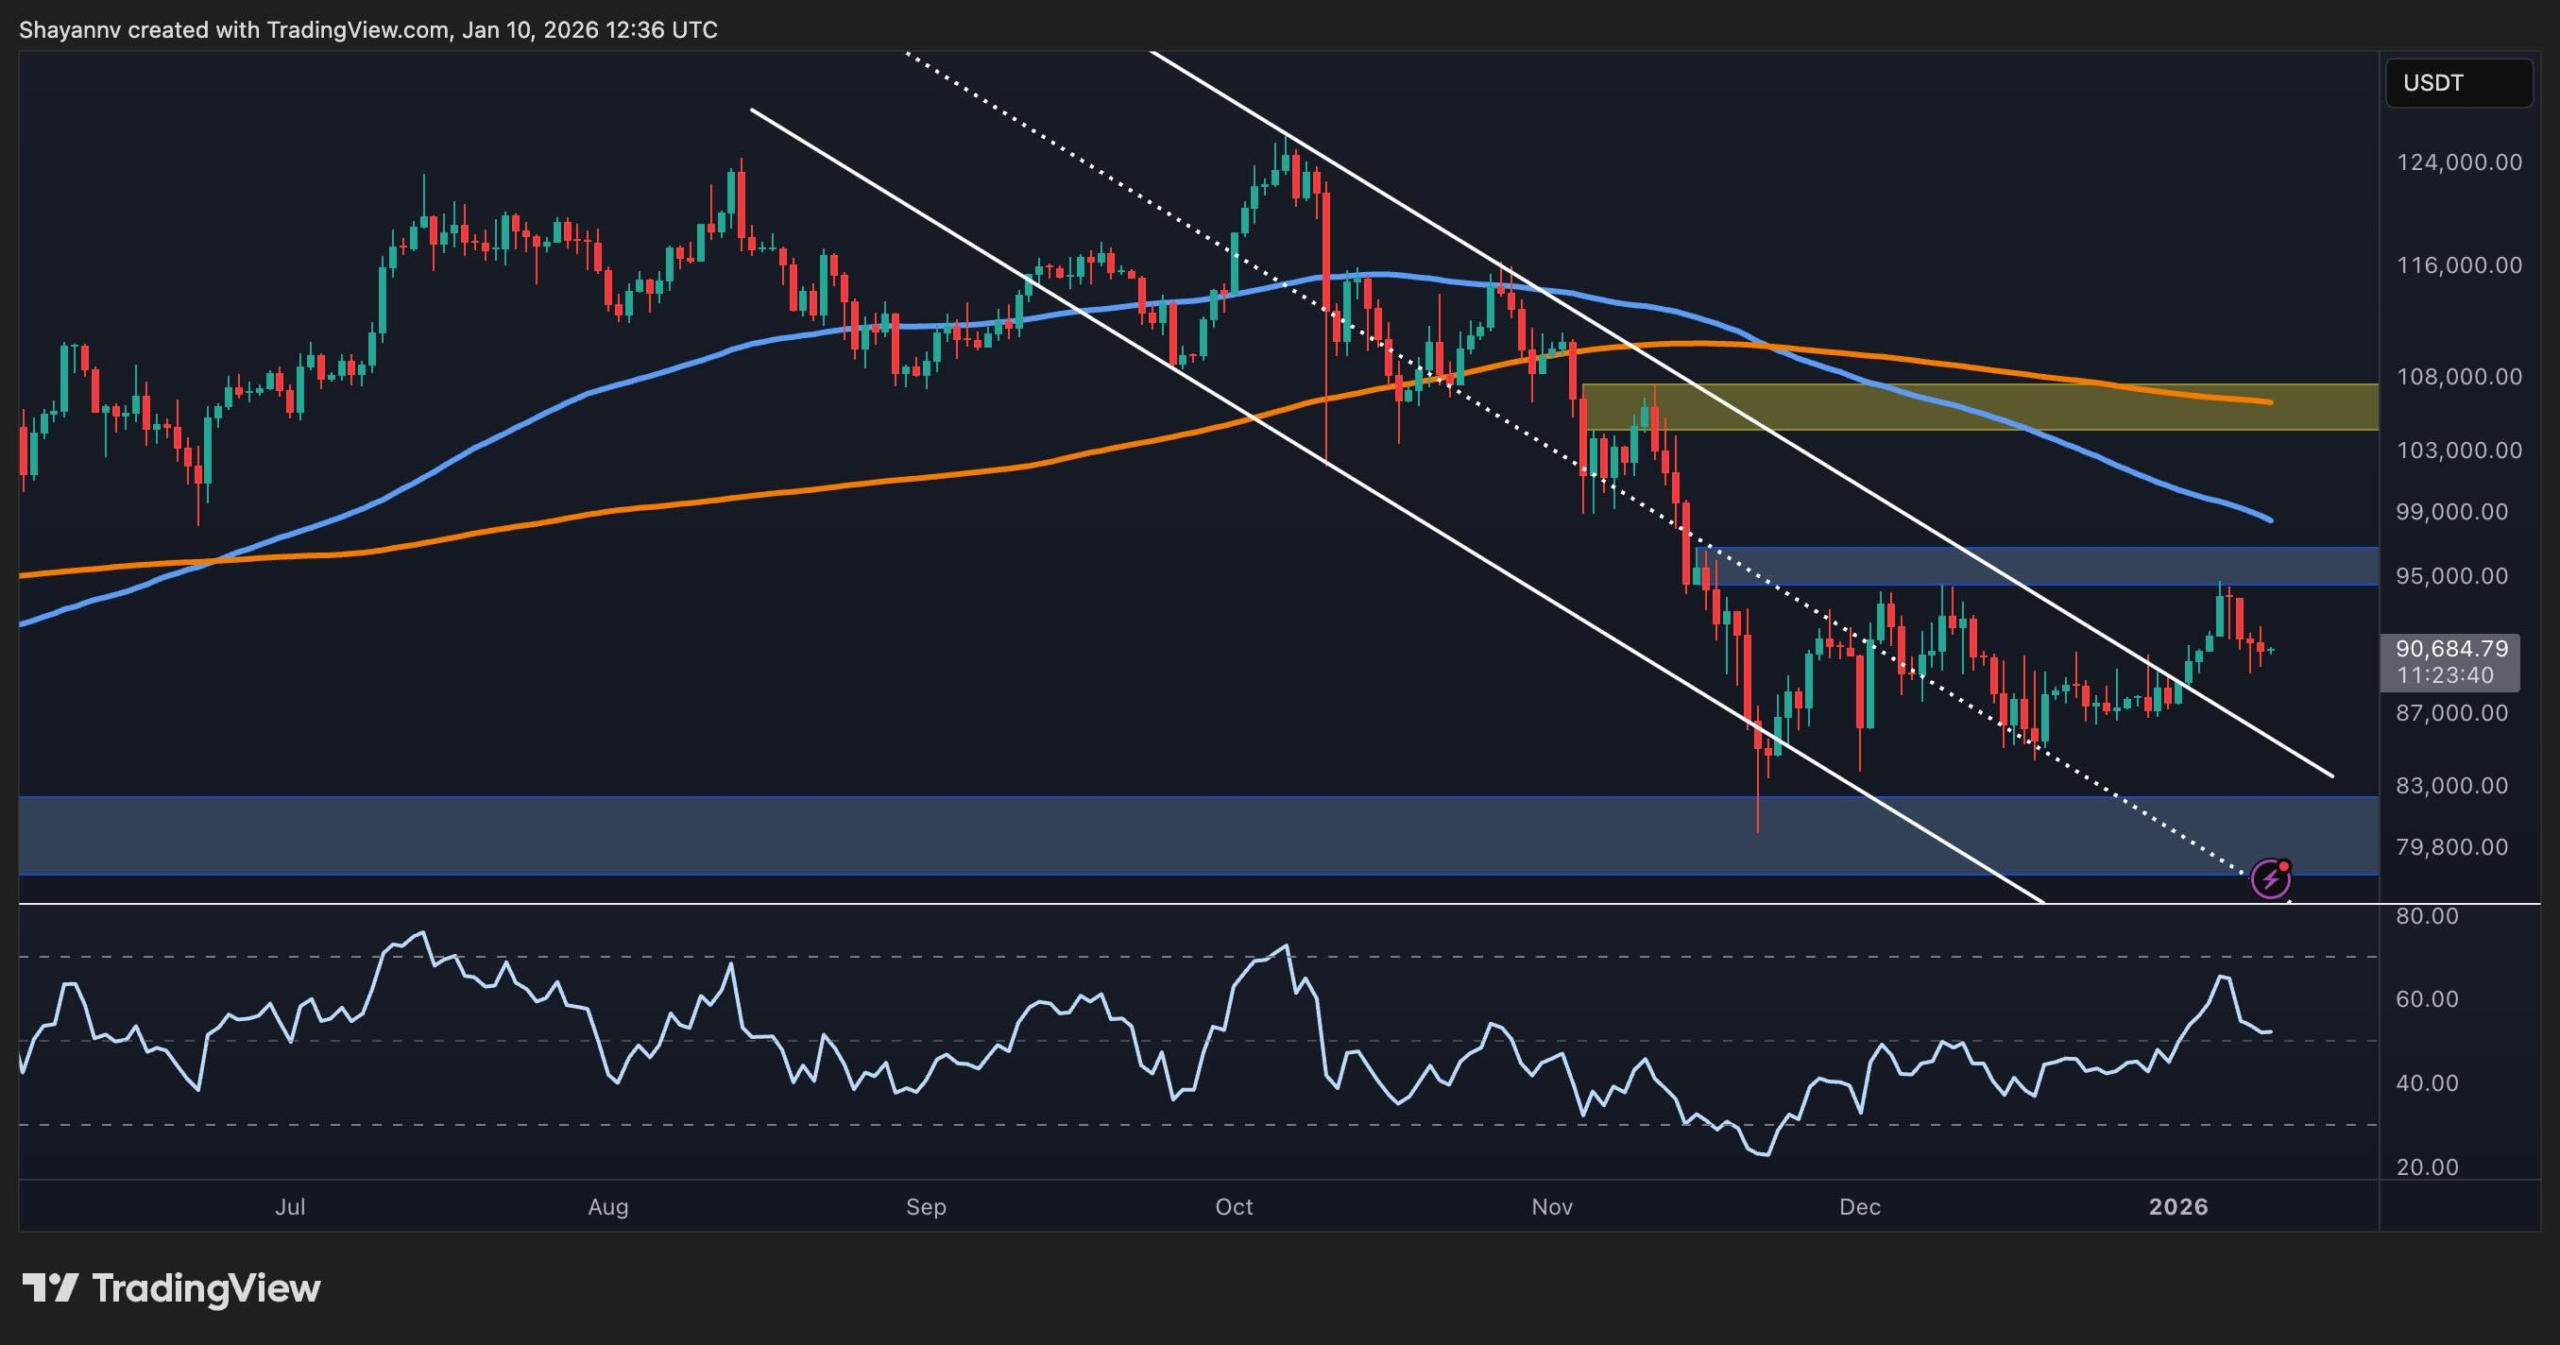
Bitcoin continues to consolidate near the $90k mark as global financial markets remain under pressure. Geopolitical tensions in the Middle East, growing uncertainty around fiat currency stability in emerging markets, and macro volatility have once again pushed BTC into the spotlight.
Bitcoin Price Analysis: The Daily Chart
On the daily timeframe, BTC has broken out of its descending channel but is facing resistance near the $95k zone. The rally from the $80k low has been sharp, but it now appears to be cooling down after hitting the key resistance level at $95k. The price is yet to reclaim the 100-day and 200-day moving averages, which are sitting just near the $99k and $106k levels, respectively.
The structure is now attempting a shift from bearish to neutral. If BTC can hold above the $90k psychological level, there is potential for a higher low to form, opening the door for continuation toward $95k and possibly the critical $100k zone. But failure to hold the $90k zone could send the price back into the prior downtrend channel.
BTC/USDT 4-Hour Chart
On the 4-hour timeframe, BTC is consolidating in a rising wedge pattern, with local support around $90k and immediate resistance near $95k. The structure shows signs of weakening bullish momentum, as RSI continues to drift lower despite the price holding above key support.
‘); AdButler.ads.push({handler: function(opt){ AdButler.register(183000, 631314, [300,250], ‘placement_631314_’+opt.place, opt); }, opt: { place: plc631314++, keywords: abkw, domain: ‘servedbyadbutler.com’, click:’CLICK_MACRO_PLACEHOLDER’ }}); ]]>
A breakdown below $90k could accelerate the correction toward the lower boundary of the pattern at $88k. On the other hand, a breakout above $95k could spark a new wave and lead to a bullish breakout from the falling wedge, which usually results in aggressive rallies. Until then, BTC appears to be trading within a tightening range.
On-Chain Analysis
The 30-day EMA of the SOPR (Spent Output Profit Ratio) has been hovering just below the 1.0 mark. This suggests that a large portion of spent coins are realizing losses, or in other words, many short-term holders are exiting without profit. Historically, when SOPR drops below 1 and flattens, it often signals the final phase of a correction, or potential accumulation by stronger hands.
The SOPR trend still shows some downside pressure, but the price itself is showing relative strength. If BTC can sustain above $90k while SOPR resets, it could set the stage for a healthier rally driven by a more solid base.
SPECIAL OFFER (Exclusive) SECRET PARTNERSHIP BONUS for CryptoPotato readers: Use this link to register and unlock $1,500 in exclusive BingX Exchange rewards (limited time offer).
Disclaimer: Information found on CryptoPotato is those of writers quoted. It does not represent the opinions of CryptoPotato on whether to buy, sell, or hold any investments. You are advised to conduct your own research before making any investment decisions. Use provided information at your own risk. See Disclaimer for more information.